Uncertainty is how "certain" your data is. In other words, if you have a shapefile for the outline of a building, how closely does it match the outline of the building. The data will never be exactly correct, there is always some level of uncertainty. It does not matter if you use the best equipment available, there is still some level of uncertainty.
Uncertainty is also referred to as "error" but this term is a little misleading. Uncertainty is a very general term and includes all the different types of issues that makes our data different from what is actually on the ground.
There is an entire discipline around "Quality Assurance" and/or "Quality Control" (QAQC) that concern themselves with managing quality of products. This is directly related to uncertainty as ensuring the "quality" of a product is about reducing the uncertainty in manufacturing so that each product that is made is similar to the one before it. Without controlling the quality of a product, you cannot be assured of it will work. Quality Assurance is also well developed in engineering but unfortunately, it is not well developed in the geospatial disciplines.
All data has a uncertainty. If you try to hide the uncertainty in your data, you'll be wrong and might get caught at it. If you analyze and document the uncertainties in your data, you will be wrong less and if anyone "caches" the uncertainties, you can always point at them in your documentation. I highly recommend at least documenting everything you know about the uncertainty in your data and results. At least this will help others make decisions while taking the uncertainties into account. You may also save someone's life. Below are some examples of the impacts errors in spatial data have caused.
You could also argue that these problems would not have existed if folks documented the uncertainty in their data and the users were aware of the uncertainty. The real danger is that folks see maps are perfect when they are not. I hope one day we will see maps accompanied by "uncertainty" information just as they have legends and scale bars.
“All models are wrong but some are useful”
- George E. P. Box
“All data is wrong but some is useful”
- Jim Graham
If a DEM is accurate to 30 meters: You can’t use it to design a road. You can use it to predict large land slides.
The critical element is to know what is required to solve the problem you have before you and then make sure you have data that can solve that problem.
Below are some of the types of errors
There are a wide variety of errors that are "gross" or very large in nature. These errors tend to be hard to quantify and remove from our data. Specific examples I have seen include:
There is not a lot we can do about these types of errors except quantify the number of them so we know how "uncertain" we should be. For example, a student showed that the average correct identification rate for herbariums in the Rocky Mountain States was about 95%. Thus, we can assume that folks trained in taxonomic identification have about a 5% error rate.
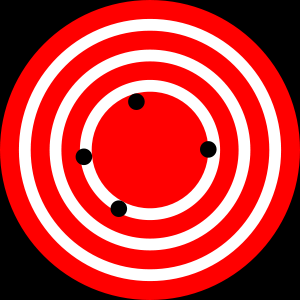
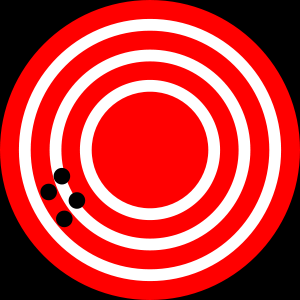
The terms "precision" and "accuracy" are important and often miss used. The two "targets" below show the difference between accuracy and precision.
|
|
| High Accuracy, Low Precision | Low Accuracy, High Precision |
|---|
See: http://en.wikipedia.org/wiki/Accuracy_and_precision
Another way to look at these terms is:
Precision and Accuracy are both important. However, it is easier to correct for accuracy because we "shift" the data to be closer to be more on target. It's hard to increase the repeatability of measurements without spending money on better equipment and taking more time to take more precise measurements.
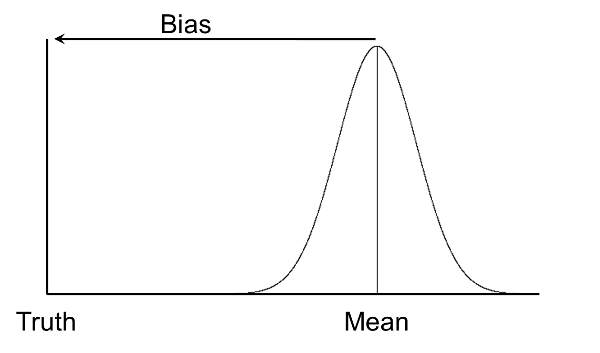
We are all biased. The issue is how to compensate for it.
Bias is a tendency toward a certain value or range of values. We like to walk on flat areas rather than up steep slopes. This explains why there are a larger number of occurrences for plant species on flat areas than in hilly areas.
The great thing about bias is that we can correct for it after we characterize it. The graph below shows how a set of samples can be off from "Truth". If we know the distance (amount of bias) then we can subtract that value from the data and shift the values back to "truth". Unfortunately, we never actually know "truth", however, we do sometimes know something that is much higher resolution than the data we are working with and can use this information to determine the bias. Even doing this on a small sample can be helpful in reducing the uncertainty for a larger data set. This is also known as "ground truthing".
There are a number of different means of characterizing uncertainty, specifically precision, in our data:
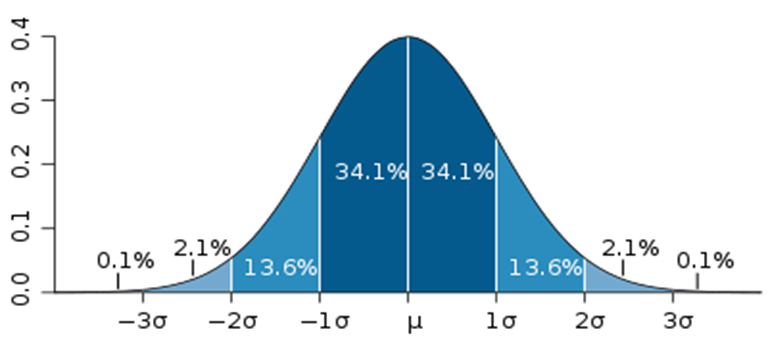
Standard Deviation ("Std Dev") is the most commonly used. Std. Dev. assumes that the data is normally distributed and extends from negative to positive infinity. Std. Dev. can be used with data that is not quite normally distributed but should not be used for data that will never fit a normal curve. Examples where it should not be used include measures of amount such as height, weight, length, etc. because these values start at 0 and can have many values at 0. If the mean value of these measures is much larger than 0 (i.e. the left side of the tail of the curve does not have values near 0, Std Dev may be used.
Source: Wikipedia
Uncertainty can come from a variety of places, some quite surprising. The diagram below shows a typical flow of data from the "Real World" through to humans making decisions. Errors can occur at almost every level (it's probably a philosophical discussion if the "Real World" contains uncertainty or not).
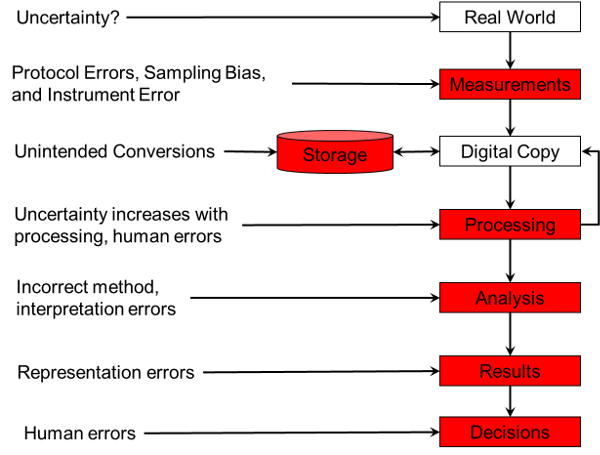
The biggest problem with data from the field is the lack of a PROTOCOL! A protocol is simply the series of steps that the field crew uses to gather data but it is critical to make sure the data is collected in a known and repeatable way. A protocol should include:
The Globe program has some excellent protocols.
Your field work should also include a detailed form with:
Problems with protocol's come from:
Field data collection has failed for many reasons including:
Think about the sampling bias that occurred while you data was being collected. What is done with a fully random plan (really rare), a stratified random approach (happens sometimes), just as the opportunity arose (really common).
All of these sources of bias and others can effect your data. Many of them can be compensated for if you know how the data was collected.
Users introduce errors all the time and we rarely realize it. It's good to calibrate your users. In a test of identifying invasive species, we found that volunteers were only 76% accurate but experts where just over 90%. Training would help in both cases but testing them let us know what the error rate was so we could report it.
Users are also susceptible to"drift". You probably more effective right after a training than a couple weeks later. You are also probably better in the late morning than right after lunch!
All of our instruments have some "error rate" and many of them have documented calibration processes. GPSs have "HDOP" or horizontal dilution of precision. This is defined by the manufacturer so we don't really know how to correlate it to a standard error measure. However, it is easy to setup a "benchmark" and test your GPS repeatedly. You'll need to do this several times as the position of the satellite and atmospheric effects change over time. This is called calibration and it lets you know what the uncertainty is for every piece of equipment and you can do it for humans as well.
Normally, when we store data into a file we expect it to come out as the same values. Unfortunately, this is not always the case.
Excel, and other software packages will change values as in the examples below.
Databases have an interesting effect on dates where if you store the year 2012 into a database as a date, the database will return "2012-01-01 00:00:00.00", or midnight of the first of January of that year. This might not be a big problem unless you want to do a study that requires data accuracy to a month and you have some of this yearly data mixed in (see GBIF). What is needed here is a setting for the "Precision" of the data that can be set to "Year" so we know the data is only accurate to a year.
I believe the most important step to take is to document what you know (or don't know) about the uncertainty of your data. This can be recorded in metadata. Your products should also include: data sources, sampling procedure and bias, processing methods, and, when possible, an estimate of the uncertainty.
FGDC Standards
The Federal Geographic Data Committee document FGDC-STD-007.3-1998 includes Geospatial Positioning Accuracy Standards in Part 3 (Section 3.2.1):
Significant digits is another way we can communicate the uncertainty of our data. When reporting computed values, remember to limit the number of digits based on the original uncertain of the data. This means that if the smallest number of digits provided in a value in an equation is 2, then we can only report numbers with 2 significant digits. The other way to look at this is that we cannot create precision:
We can keep the digits for calculations but should remove them for reports.
© Copyright 2018 HSU - All rights reserved.